This Shiny app allows learners to explore how the centre and spread of a sample mean compare to the centre and spread of the distribution of the individual measurements.
Suggested progression with the app:
- Set the parameters as follows:
- Sample Size per Trial = 1
- Skew = 0
- Number of Trials = 1
and repeatedly generate samples to see the behaviour of individual measurements that are a sample from a normal distribution.
- Increase the Number of Trials to get a large number of samples and note the distribution of the samples in the histogram in the lower plot. Compare this distribution to the probability distribution of the individual observations in the upper plot.
- Change the Sample Size per Trial to a number between 5 and 10 and the Number of Trials to 1. Note that the upper plot shows the sample and the sample mean. The sample mean is also plotted on the lower plot. Generate many samples and observe how the samples and means behave.
- Generate many samples and observe how the distribution of the samples means in the lower plot compares to the probability distribution of the individual observations in the upper plot.
- Repeat 3 and 4 for a larger sample size.
Shiny app files (.zip)
Required R packages: shiny, ggvis, dplyr, sn
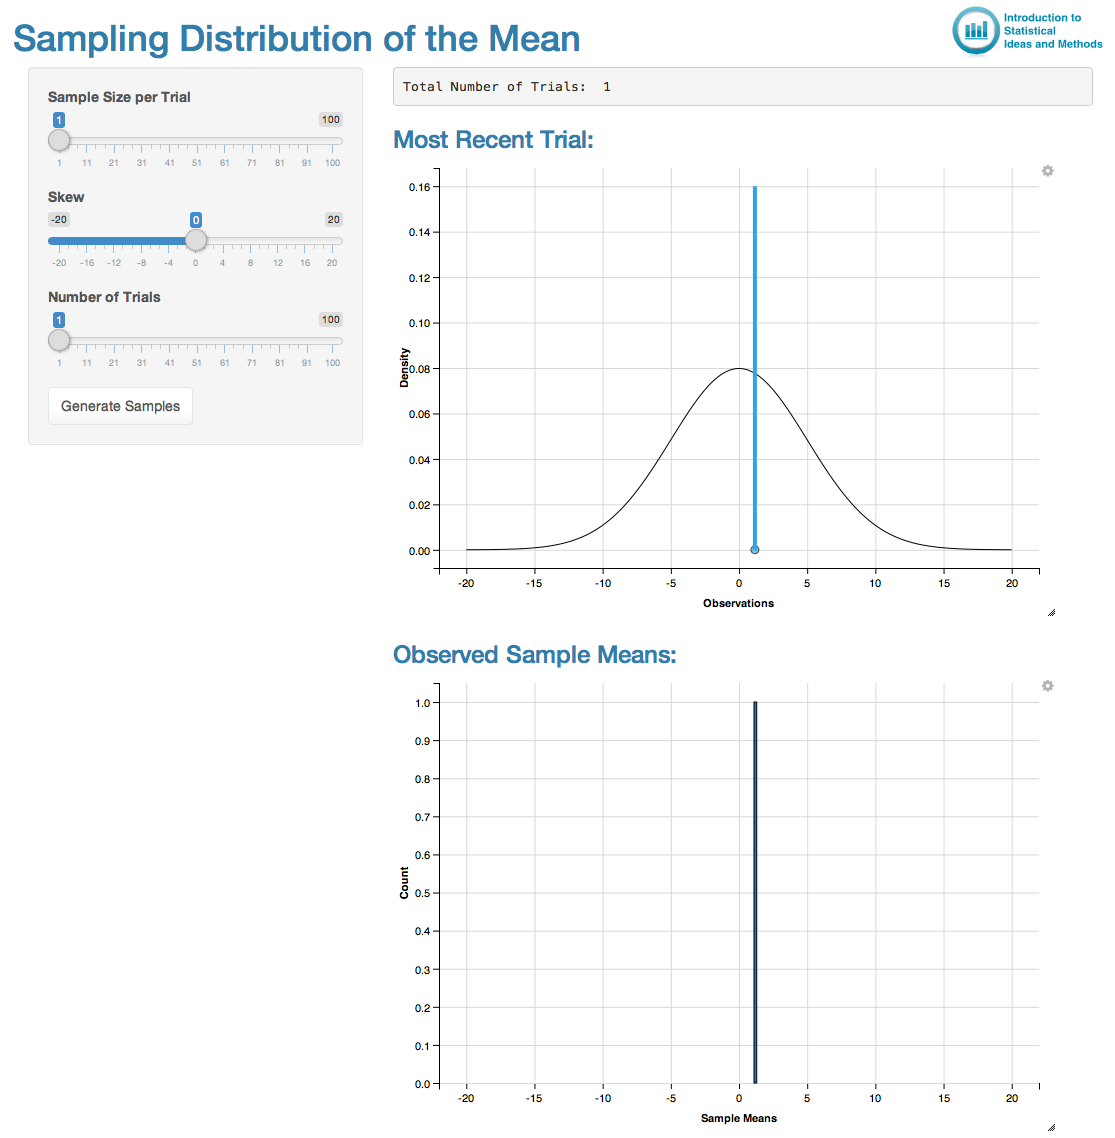
Screenshot of the Shiny app: