Skip to content

Introduction to Statistical Ideas and Methods

Online modules for introductory statistics

  • Home
  • Modules
    • Summarizing Data: One Variable
    • Summarizing Data: Relationships Between Variables
    • Data Collection
    • Probability: Events
    • Probability: Random Variables
    • Sampling Distributions
    • Confidence Intervals
    • The Process of Statistical Tests
    • The Effective Use of Statistical Tests
    • Comparing Two Groups
    • Non-Parametric Methods
    • Simple Linear Regression
  • Topics covered in each module
  • Data
    • The Skeleton Data
    • The New York Red Bulls Salary Data
    • The Life Expectancy Data
    • The Plastic Surgery Data
    • The Body Temperature Data
    • The HPV Vaccine Data
    • The Babies Crawling Data
    • The CFCs Data
    • The Anscombe Data
    • The Coffee Shop Nutrition Data
  • Probability Distribution Calculator
  • Statistical Software
  • About
  • What’s New

Explore the Skeleton Data

This Shiny app and accompanying learning activity are designed for learners to apply the methods in this module to explore the Skeleton Data. Learners should first read the information about the Skeleton Data.

Learning activity (pdf)

Shiny app files (.zip)
Required R packages: ggplot2, lattice

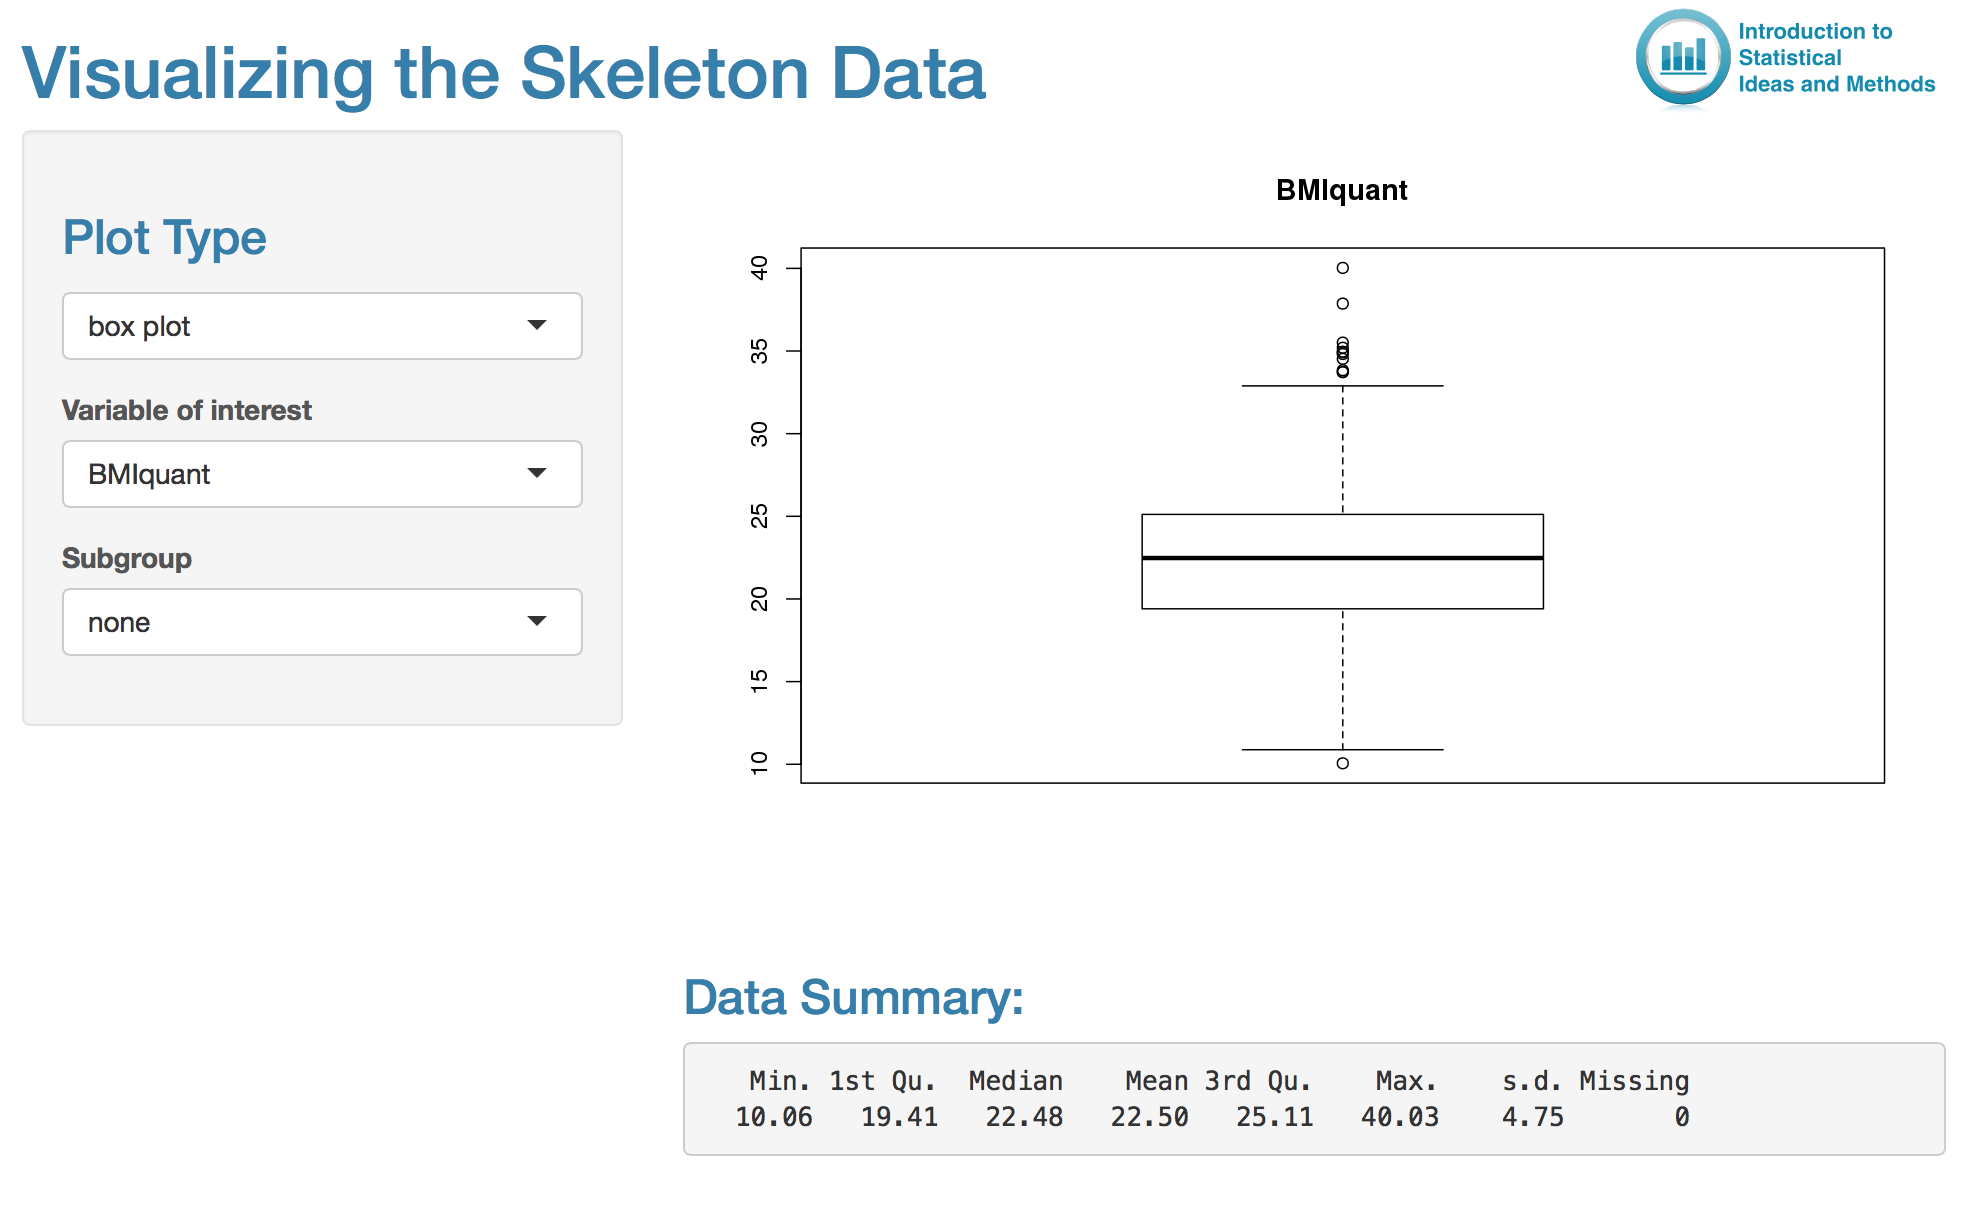
Screenshot of the Shiny app:

Screenshot of Shiny app Visualizing the Skeleton Data


Proudly powered by WordPress