Consider the histograms below which show the grades in two classes, each of 200 students. The mean grade in the first class is 70 with a standard deviation of 8. The mean grade in the second class is also 70, but with a standard deviation of 3. 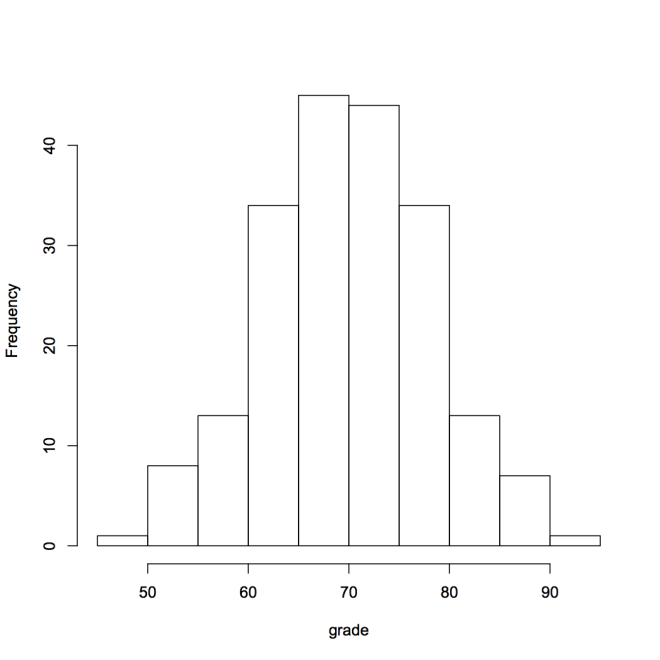
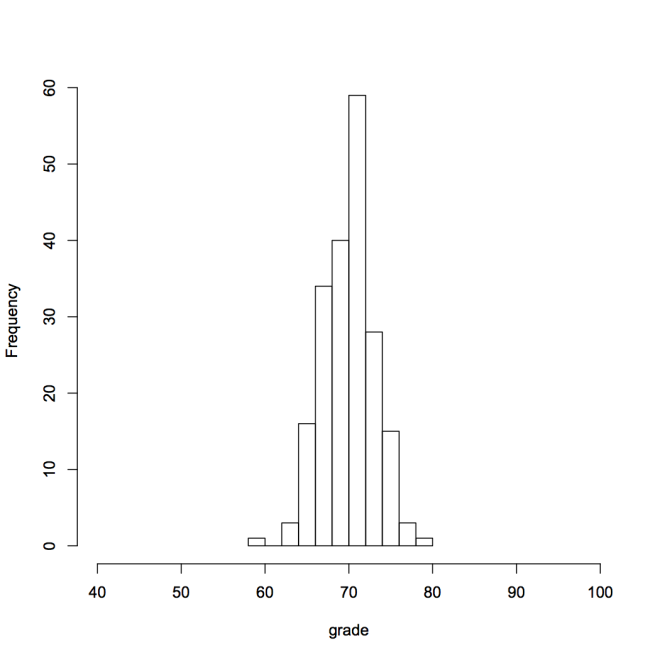
- Something to think about: In which class would you rather be a student? Why?
Here is a histogram of a 3rd class of 200 students. For this class, the mean grade is 75 and the standard deviation of the grades is 4. 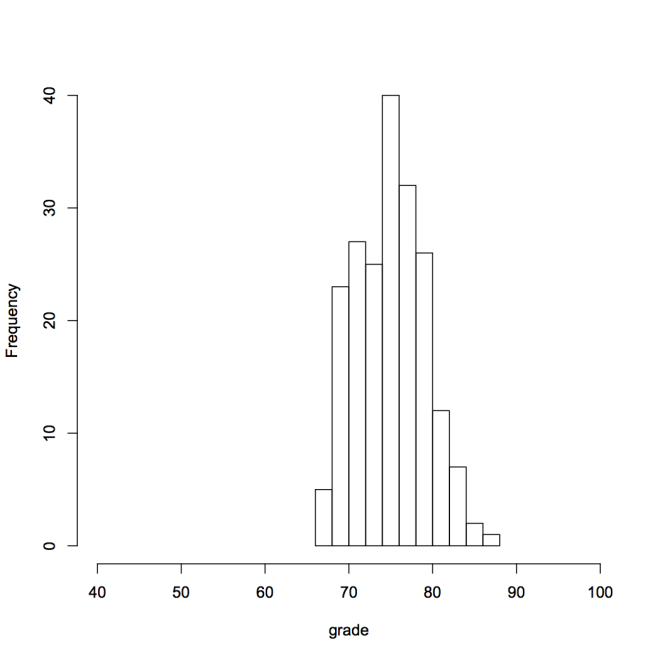 Imagine 3 students, 1 in each class. They all got a grade of 80. Which one is the “best” student? We’ll consider how we can fairly compare them to account for the differences in the means and standard deviations of the classes. A z-score is an adjustment of a data value to get its position in a data set. It tells you how many standard deviations a data value is away from its mean. To get the z-score a data value, subtract the mean from the data value and divide the result by the standard deviation. A z-score of -1.0 tells you that the corresponding data value is one standard deviation below the mean. A z-score of +2.5 tells you that the corresponding data value is 2.5 standard deviations above the mean. Z-scores allow you to compare the relative position of data values from different sets of data. In class 1, the z-score of the student with the grade of 80 is (80-70)/8=1.25. In class 2, the z-score of the student with the grade of 80 is (80-70)/3=3.3. In class 3, the z-score of the student with the grade of 80 is (80-75)/4=1.25. The student with the grade of 80 in the second class is much more unusual as his or her grade has a z-score of 3.3. That is, his or her grade is more than 3 standard deviations above the mean.
- Something to think about: Using the empirical rule, how often will a student get a grade more than 3 standard deviations above the mean, like the student in class 2 did?