Continuing with the Shiny app: Sampling Distribution of the Mean, learners can explore the shape of the distribution of the sample mean when the probability distribution of the individual measurements is skewed and how this shape varies with sample size.
Using the app:
- The Skew parameter can be set to a positive value to make the probability distribution of the individual observations right-skewed. The larger the value of Skew, the more skewed the probability distributions. Negative values of Skew give left-skewed probability distributions of the individual observations.
- The upper plot shows a random sample from the probability distribution of the individual observations and the sample mean of this sample. The lower plot shows a histogram of many sample means. Learners can see the shape of the distribution of the sample means by generating many samples and observing the shape of the resulting histogram.
Shiny app files (.zip)
Required R packages: shiny, ggvis, dplyr, sn
Note that this is the same app used to explore The Distribution of the Sample Mean: Mean and Variance.
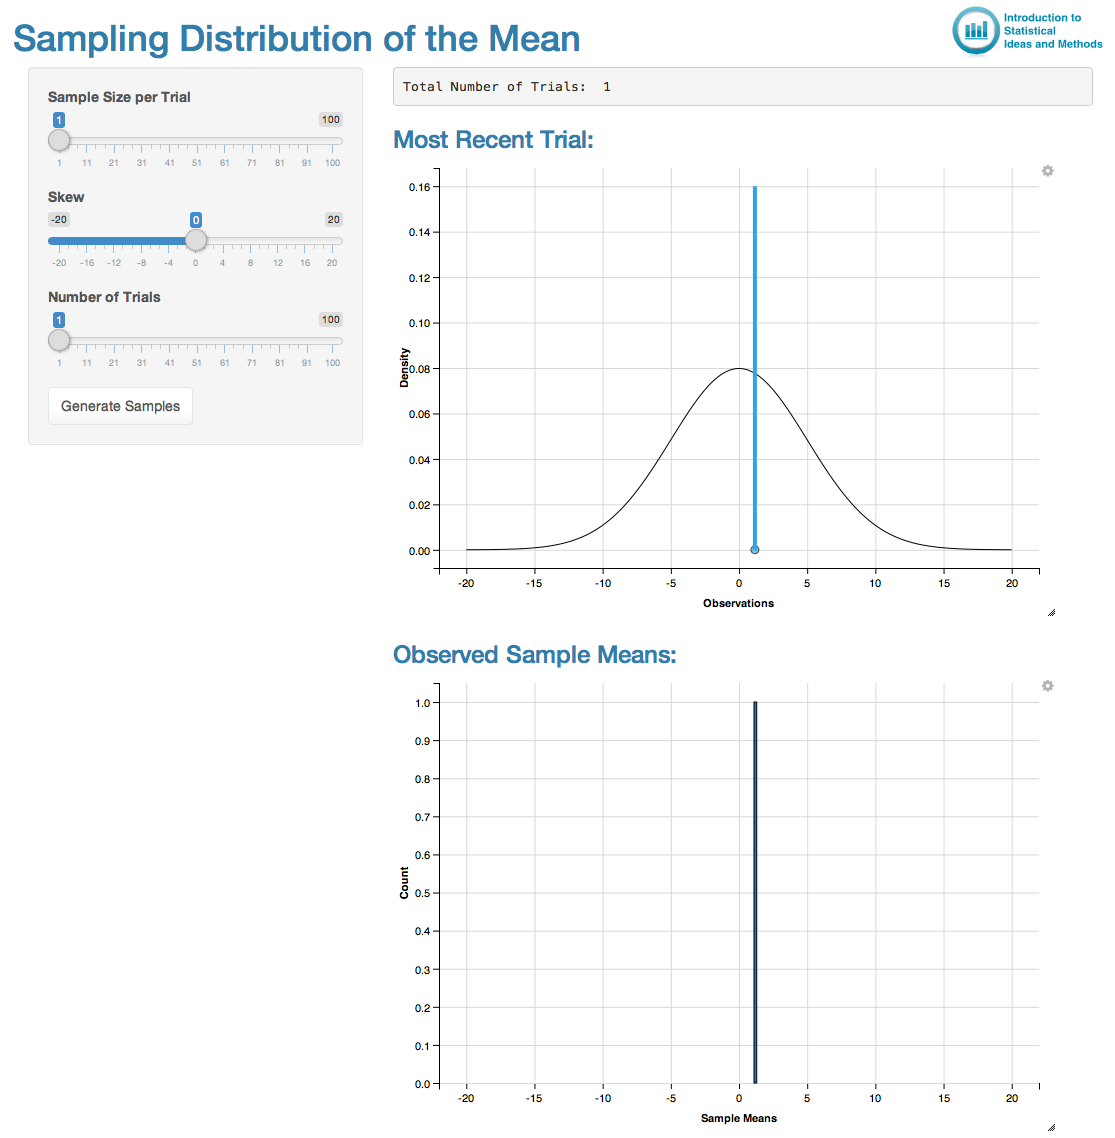
Screenshot of the Shiny app: